catRAPID 'omics'
The catRAPID omics module allows the prediction of RNA-protein partners on in a number of model organisms.
Submission form (protein vs transcriptome)
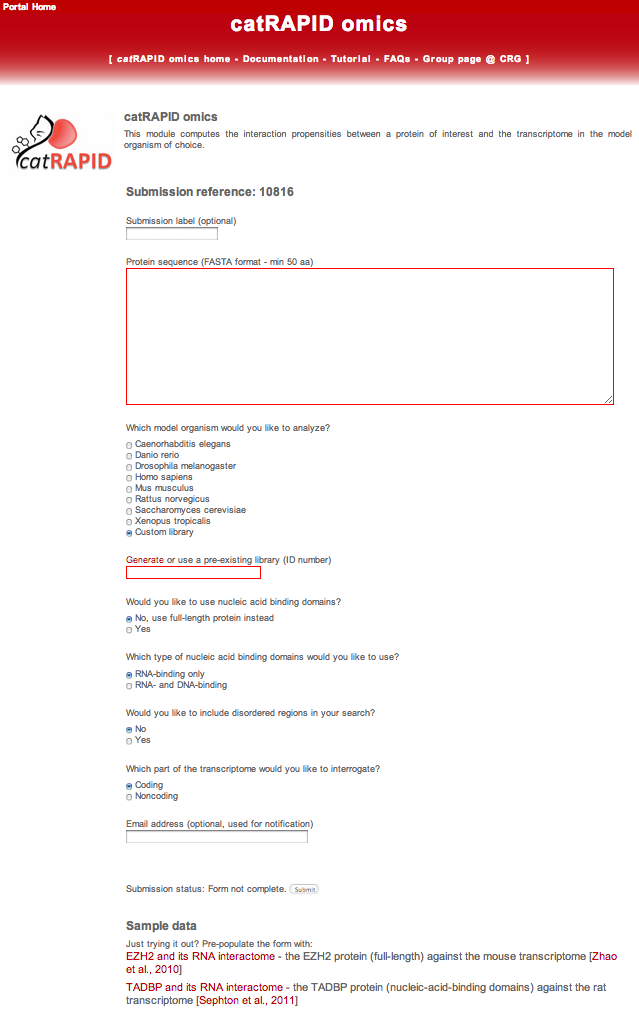
As soon as the catRAPID omics module is selected in the catRAPID home page, the server generates automatically a unique reference number for the submission. The user can optionally choose a custom submission label:
The algorithm exploits a series of pre-calculated reference datasets that could be employed in the computation of the interactions. In order to focus on specific associations, several options are provided to the user.
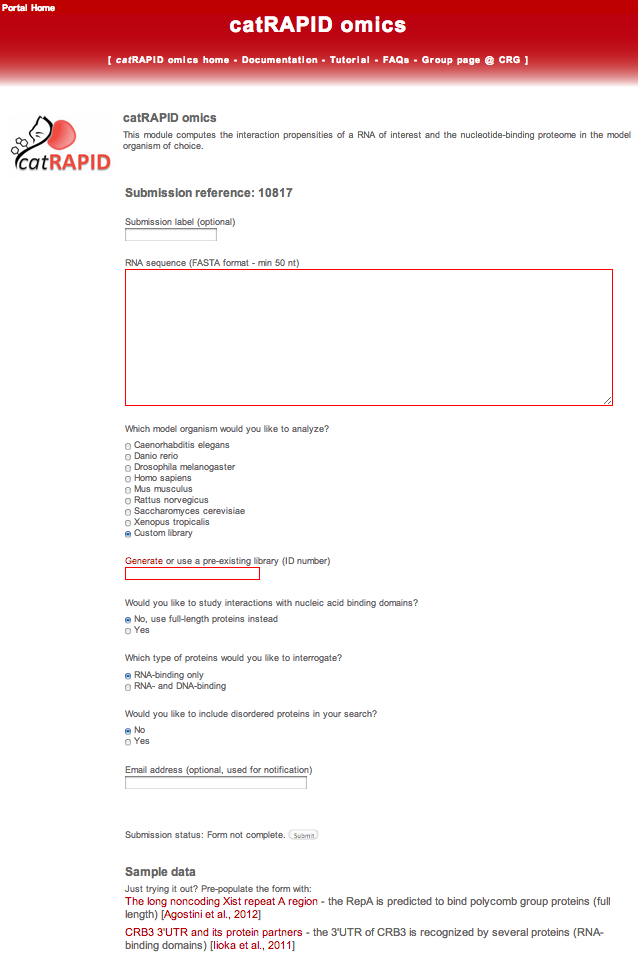
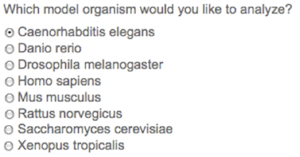
The first option is the organism that will be used for the calculation of the interaction propensities with the transcriptome.

At this point, the user can either choose one of the pre-calculated datasets or a custom library. The custom library can be created by clicking on the "Generate" link and then used for the calculation by filling in the box below with the new or pre-existing library ID.
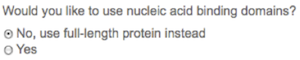
The user will be asked which analysis should be performed on the input protein sequence. The user can use 1) full-length protein, if the sequence size belongs between 50 and 750 amino acids, or alternatively 2) protein domains. Protein domains are identified with hmmscan [Finn et al., 2011] and Pfam-A reference database [Finn et al., 2010].
If the user decides to search for domains within the input protein, the calculation is restricted to a specific set of binding domains or extended to disordered regions.
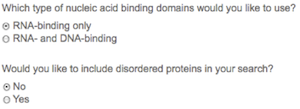
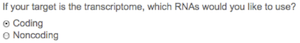
The calculation can be restricted to a particular class of RNA.
Finally, the user can provide an email address to receive the notification of job completion (optional).
Interpreting the output (protein vs transcriptome)
Let’s try catRAPID omics with one example. Click on the link “TARDBP and its RNA interactome” and the TARDBP fasta sequence will be uploaded and Rattus norvegicus will be used as model organism. TAR DNA-binding protein 43 (TDP-43) is implicated in gene transcription, pre-mRNA splicing, mRNA stability, and mRNA transport. catRAPID omics is able to identify significant a number of TDP-43 RNA targets [Sephton et al., 2010] in the top-ranked predicted interactions (P-value = 2.01x10⁻³, Fisher’s Exact Test)
Once the prediction is completed, the result page will present a summary about the job:
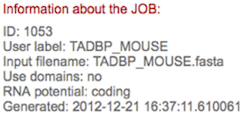
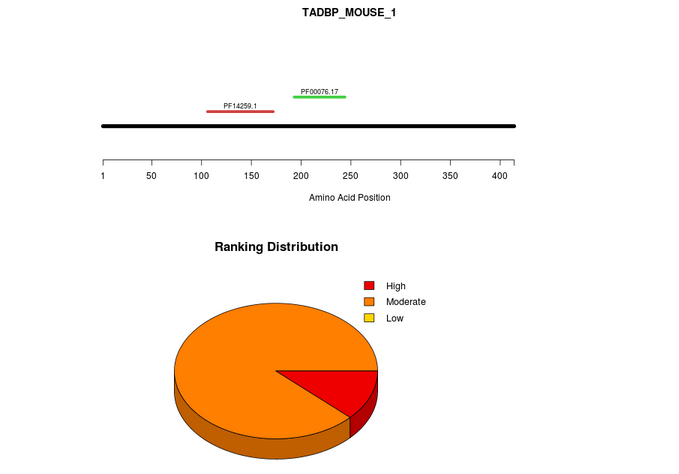
The output consists of a graphical representation of the sequence/domains employed for the calculation, a pieChart and a table. The first plot represents the input molecule (black line) and the domains (if any) identified and used for the analysis (colored lines). The pieChart shows the distribution of the associations based on the star rating system. The association are grouped in three different classes according to their star rating score: High (3-2), Moderate (2-1), Low (1-0).
In the table are reported the top-ranked interacting pairs (0.5% of the reference transcriptome) with their respective interaction propensity, discriminative power and interaction strength values. Two additional columns indicate the presence of protein nucleic-acid-binding domains or RNA recognition motifs. The ranking is visualized as a “star rating system” ranging from 3 (highest quality) to 0 (lowest quality).
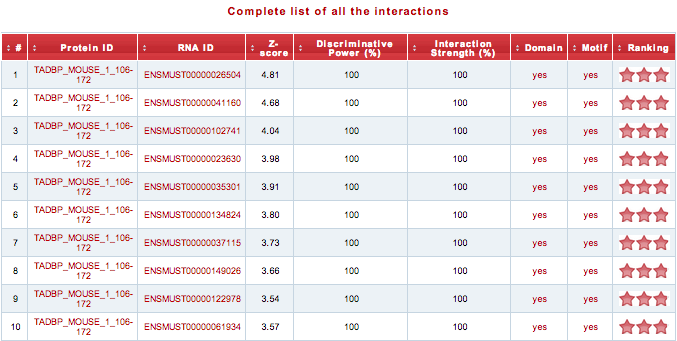
Using the link above the table, the user can download the “Complete list of all the interactions”.
Submission form (transcript vs nucleic acid binding proteome )
As soon as the catRAPID omics module is selected in the catRAPID home page, the server generates automatically a unique reference number for the submission. The user can optionally choose a custom submission label:
The algorithm exploits a series of pre-calculated reference datasets that could be employed in the computation of the interactions. In order to focus on specific associations, several options are provided to the user.
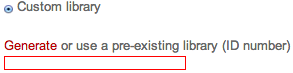
The first option is the organism that will be used for the calculation of the interaction propensities with the nucleic-acid binding proteins.
At this point, the user can either choose one of the pre-calculated datasets or a custom library. The custom library can be created by clicking on the "Generate" link and then used for the calculation by filling in the box below with the new or pre-existing library ID.
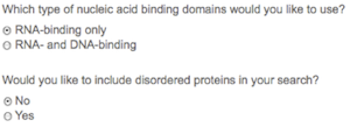
The user will be asked which analysis should be performed on the reference protein sequences. The user can use 1) full-length proteins, which means that only sequences between 50 and 750 amino acids are selected for the calculation of the interactions, or alternatively 2) protein domains. Protein domains are identified with hmmscan [Finn et al., 2011] and Pfam-A reference database [Finn et al., 2010]. In the reference sets the binding domains are associated with sequences whose length can exceed the size of 750 amino acids.

If the user decides to search for domains within nucleic acid binding proteins, the calculation is restricted to a specific set of binding proteins or extended to disordered proteins.
Finally, the user can provide an email address to receive the notification of job completion (optional).
Interpreting the ouput (transcript vs nucleic acid binding proteome )
Let’s try catRAPID omics with one example. Click on the link “The long noncoding Xist repeat A region” and the Repeat A fasta sequence will be uploaded and Mus musculus will be used as model organism. The Polycomb repressive complex 2 (PRC2) plays a major role in epigenetic silencing of the X-Chromosome. We predict that the complex subunit SUZ12 have a strong binding propensity for the RepA region, in agreement with experimental evidence [Maenner et al., 2010].
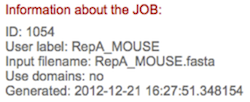
Once the prediction is completed, the result page will present a summary about the job:
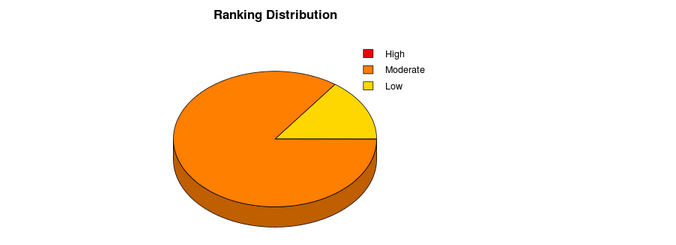
The output consists of a pieChart and table. The pieChart shows the distribution of the associations based on the star rating system. The association are grouped in three different classes according to their star rating score: High (3-2), Moderate (2-1), Low (1-0). In the table are reported the top-ranked interacting pairs (10% of the reference proteome) with their respective interaction propensity, discriminative power and interaction strength values. Two additional columns indicate the presence of protein nucleic-acid-binding domains or RNA recognition motifs. The ranking is visualized as a “star rating system” ranging from 3 (highest quality) to 0 (lowest quality).
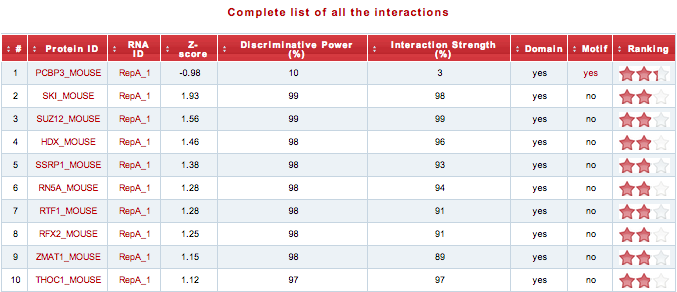
Using the link above the table, the user can download the “Complete list of all the interactions”.
It should be noted that non-interacting pairs are very rarely reported in literature, which renders it difficult to define proper negative control sets.
In our analysis, we use the hypergeometric probability to assess if catRAPID omics is able to separate interacting pairs from other protein-RNA associations.
Indeed, Fisher’s exact test takes into account the combinatorial complexity of the reference sets and allows evaluation of the significance of our predictions.
catRAPID library
catRAPID library module allows the user to generate the internal parameters (library) for the calculation of new cases.
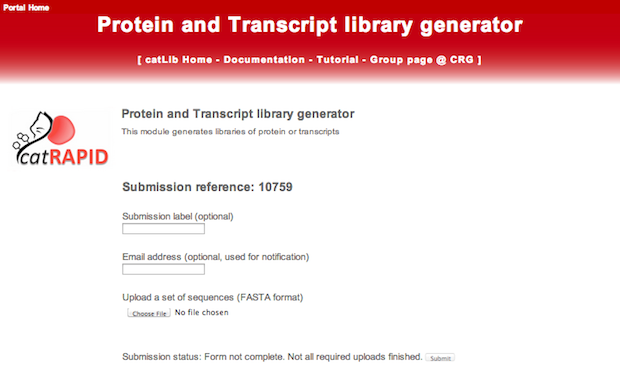
As soon as the catRAPID library module is selected, the server generates automatically a unique reference number for the submission. The user can optionally choose a custom submission label and an email address to receive the notification of job completion (recommended). Indeed, the calculation of the transcript libraries can take some times, depending on the length and number of the entries.
Finally, the user has to provide a file containing the sequences (FASTA format). Proteins must contain at least one nucleic-acid-binding domain (RNA or DNA) and be in the range 50 - 750 amino acids. Protein domains are identified with hmmscan [Finn et al., 2011] and Pfam-A reference database [Finn et al., 2010]. RNAs must be in the range 50 - 1200 nucleotides. At the moment, the number of sequences is limited to 500 transcripts and 500 nucleic-acid-binding proteins. If more sequences are provided, these will not be calculated.
By clicking the “Submit query” button, the job is submitted to the computation queue and the user can load the output page that is refreshed every 10 seconds. The user can bookmark the output page and check later the results.
Using the output library
Once the prediction is completed, the result page will present a summary information about the job:
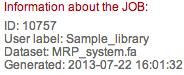
The actual prediction result is the Job ID. Indeed, the user can either click on the Job ID link to automatically redirect the library to the corresponding catRAPID omics module (transcript/protein) or take note of the Jod ID and use it later.

The user can also decide to share this ID with members of the same lab or collaborators.
catRAPID graphic
catRAPID graphic module enables a quick assessment of the interaction propensity of a protein-RNA pair.
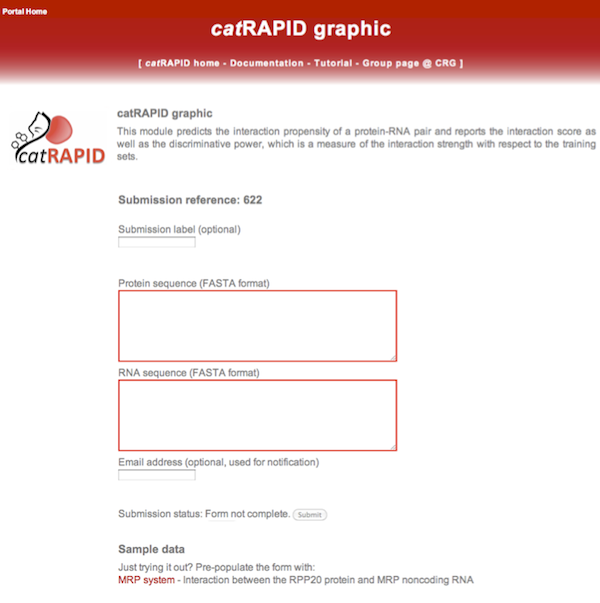
As soon as the catRAPID graphic module is selected in the catRAPID home page, the server generates automatically a unique reference number for the submission. The user can optionally choose a custom submission label:
After copy and pasting the protein and the RNA sequences in the corresponding text boxes, the server will check if the input data fulfill the length restrictions (50-750aa for proteins and 50-1200nt for RNA). Finally, the user can provide an email address to receive the notification of job completion (optional).
By clicking the “Submit query” button, the job is submitted to the computation queue and the user can load the output page that is refreshed every 10 seconds. The user can bookmark the output page and check later the results.
Interpreting the output
Let’s try catRAPID graphic with a sample data.
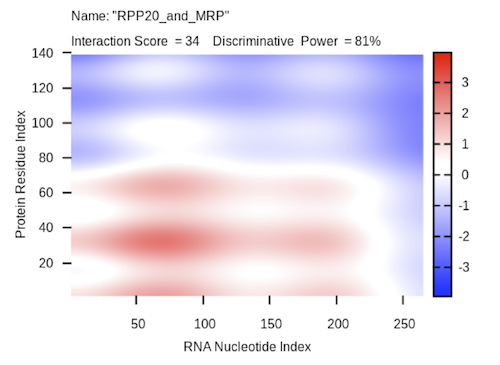
Click on the link “MRP complex” (human ribonuclease mitochondrial RNA processing complex) and the submission form will be filled automatically. The MRP assembly comprises ten protein subunits: Pop1, Pop5, Rpp14, Rpp20, Rpp21, Rpp25, Rpp29, Rpp30, Rpp38 and Rpp40. We predicted that Rpp20 binds the P3 stem of MRP RNA [Bellucci et al., 2011] as reported in the crystal structure of the MRP complex yeast homolog [Welting et al., 2004].
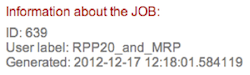
Once the prediction is completed, the result page will present a summary information about the job:
The actual prediction result is shown as a heat-map. The x- and the y-axis represent the indexes of the RNA and protein sequences respectively. The colors of the heat-map indicate the interaction score (ranging from -3 to +3) of the individual amino acid and nucleotide pairs. The total sum represents the overall interaction score. The discriminative power is also reported. For a detailed explanation of the interaction score and the discriminative power, check the catRAPID documentation page {mettere link}.
In the case of the MRP – Rpp20 association, catRAPID is able to identify the interacting regions with high confidence (interaction score = 34 and discriminative power = 81%):
catRAPID fragments
catRAPID fragments module allows the identification of protein and large RNA molecule regions that are more likely to interact.
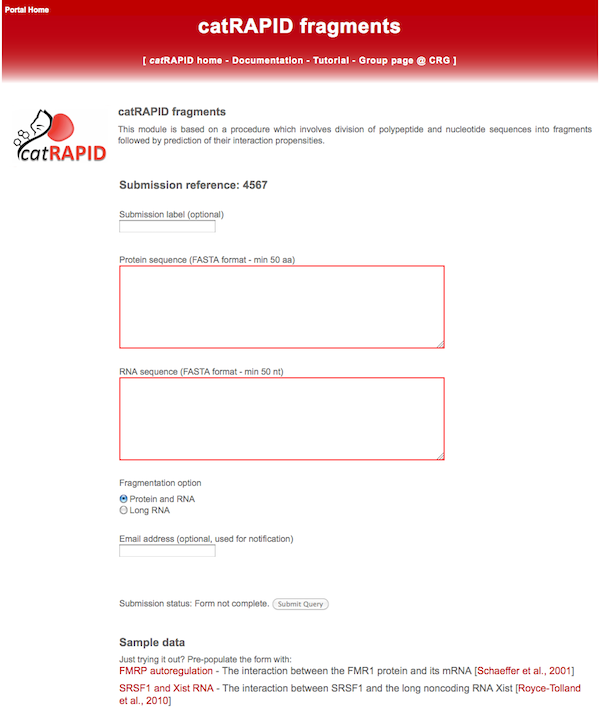
As soon as the catRAPID fragments module is selected in the catRAPID home page, the server generates automatically a unique reference number for the submission. The user can optionally choose a custom submission label:
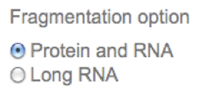
With catRAPID fragments strength allows the user to perform two different types of analysis. By using the Protein and RNA option it will be possible to provide a protein and a transcript, without any restriction on the size. The algorithm will automatically divide protein and RNA sequences into a number of fragments of fixed length (the fragment size is limited by catRAPID sequence requirements on protein and RNA molecule) [Cirillo et al., 2013]. By using the Long RNA option the size restriction applies to the protein (i.e.: 50-750aa) but not to the transcript. In this case the protein will be used as a whole and its interaction propensity calculated against the most stable local structures of the RNA. In both cases, the interaction propensity is calculated between each protein-RNA fragments.
Finally, the user can provide an email address to receive the notification of job completion (optional).
By clicking the “Submit query” button, the job is submitted to the computation queue and the user can load the output page that is refreshed every 10 seconds. The user can bookmark the output page and check later the results.
Interpreting the output
Let’s try catRAPID fragments with the first sample data (using the Protein and RNA option).
Click on the link “FMRP autoregulation” (fragile-X mental retardation 1 protein) and the submission form will be filled automatically. FMRP is an RNA-binding protein that plays a role in intracellular RNA transport and in the regulation of translation of target mRNAs. We are able to identify the domains (two KH domains and one RGG box) that are involved in the interaction with the mRNAs and the 100 nucleotides region that is responsible for the translational regulation of its own mRNA [Cirillo et al., 2012] in agreement with experimental evidence [Schaeffer et al., 2001].
Once the prediction is completed, the result page will present a summary information about the job:
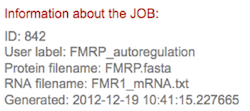
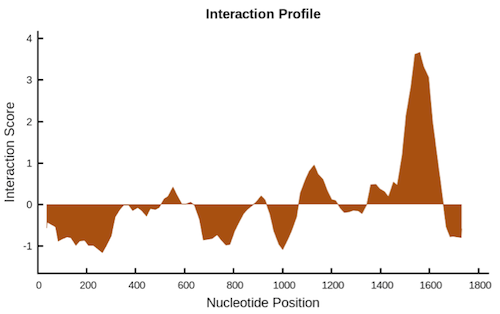
The output consists of two plots and a table, which are downloadable as png images and tab-delimited text file respectively. The interaction profile represents the interaction score (y-axis) of the protein along the RNA sequence (x-axis), giving information about the transcript regions that are most likely to be bound by the protein.
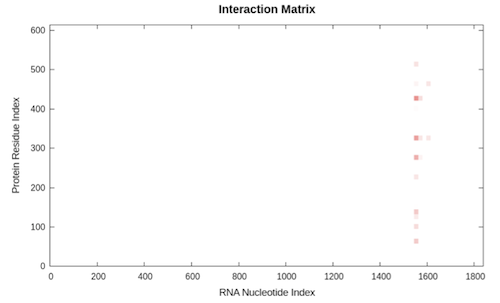
The second plot is the interaction matrix that shows, as a heat-map, the protein (y-axis) and RNA (x-axis) regions predicted to interact. The shades of red of the heat-map indicate the interaction score of the individual amino acid and nucleotide pairs.
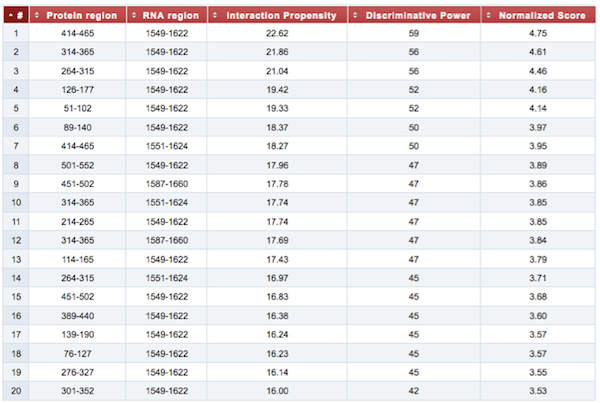
Finally, the result table summarizes the top 20 interactions, reporting the coordinates of both protein and RNA fragments that have been employed in the analysis, their interaction propensity, the discriminative power of each interaction and the normalized score used for the graphical representations. For a detailed explanation of the interaction score and the discriminative power, check the catRAPID documentation page {mettere link}.
The second sample data can be explored by clicking on the link “SFRS1 and Xist RNA” in the submission page. This example employs the Long RNA option. X inactivation is an early developmental process in mammalian females that transcriptionally silences one of the pair of X chromosomes, thus providing dosage equivalence between males and females. The long noncoding RNA Xist guides this process. We were able to identify the interaction between the splicing factor SRSF1 and the 5’ region of Xist [Agostini et al., 2012], as previously demonstrated [Royce-Tolland et al. 2010].
In this case the output consists of the interaction profile (normalized) and the table that summarize the distribution of the interaction propensities along the transcript.
catRAPID strength
catRAPID strength module allows to evalutate the significance of the interaction of a protein-RNA pair, by comparing the result with a reference set of 104 interactions.
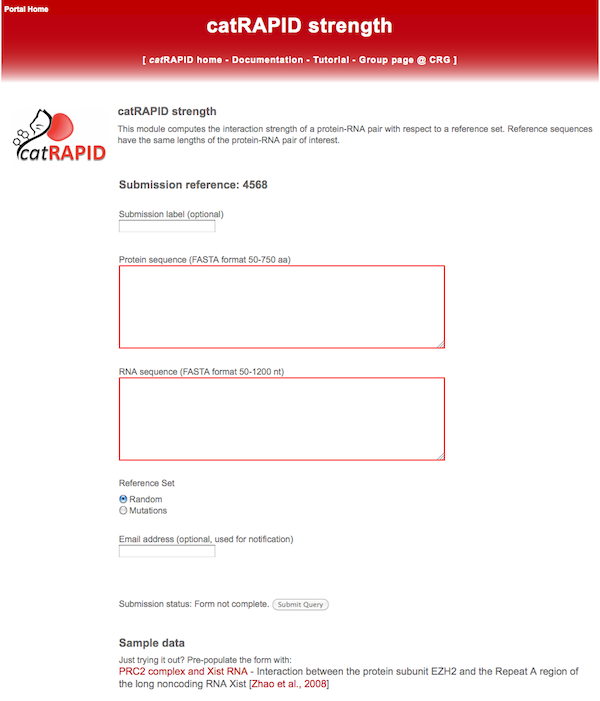
As soon as the catRAPID fragments module is selected in the catRAPID home page, the server generates automatically a unique reference number for the submission. The user can optionally choose a custom submission label:
With catRAPID strength allows the user to perform two different types of analysis. By using the Random option it will be possible to use as a reference set the results of random associations of 100 proteins and 100 RNAs having the same size of the input sequences. By using the Mutations option the reference set will be composed by the interaction scores of the associations of 100 input protein and 100 input RNA sequences, each containing a random point mutation.
Finally, the user can provide an email address to receive the notification of job completion (optional).
By clicking the “Submit query” button, the job is submitted to the computation queue and the user can load the output page that is refreshed every 10 seconds. Since catRAPID strength requires a great amount of computational power, the user is strongly encouraged to bookmark the output page and check later the results.
Interpreting the output
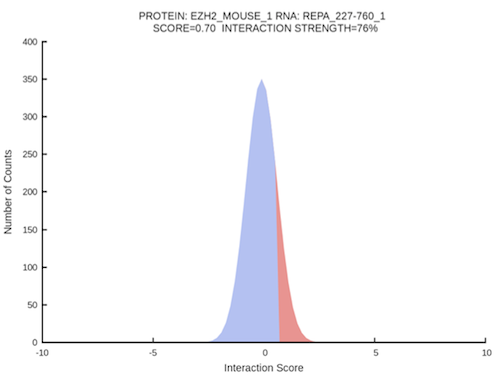
Let’s try catRAPID strength with a sample data (using the Random option). Click on the link “PRC2 complex and Xist RNA” and the submission form will be filled automatically. The major Polycomb repressive complex PRC2 contains the Suz12, Eed, Ezh2, and Rbap46-48 proteins and is involved in mediating heritable gene silencing as well as in the X-chromosome inactivation process. We predicted the interaction propensity of Ezh2 and the repeat A region of Xist and assessed its significance [Bellucci et al., 2011] as previously reported [Zhao et al., 2009].
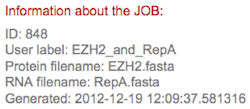
Once the prediction is completed, the result page summarizes information about the job:
The prediction output is reported in a table along with the identifiers of the input sequences, the strength type (the composition of the reference set), the number of cases, the score Z-normalized and the CDF (cumulative distribution function) of the protein-RNA interaction score. The significance of the interaction propensity is assessed against three different sets:
- Interaction → distribution of 100 RNAs vs 100 proteins (104 interactions)
- RNA → distribution of the input protein vs 100 RNAs (102 interactions)
- Protein → distribution of the input RNA vs 100 proteins (102 interactions)
The CDF value indicates the significance of the interaction propensity.
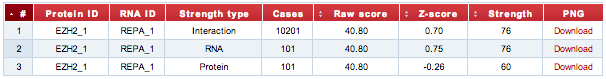
The graphical representation of the CDF distributions can be downloaded as png images by using the links in the last column of the table.